

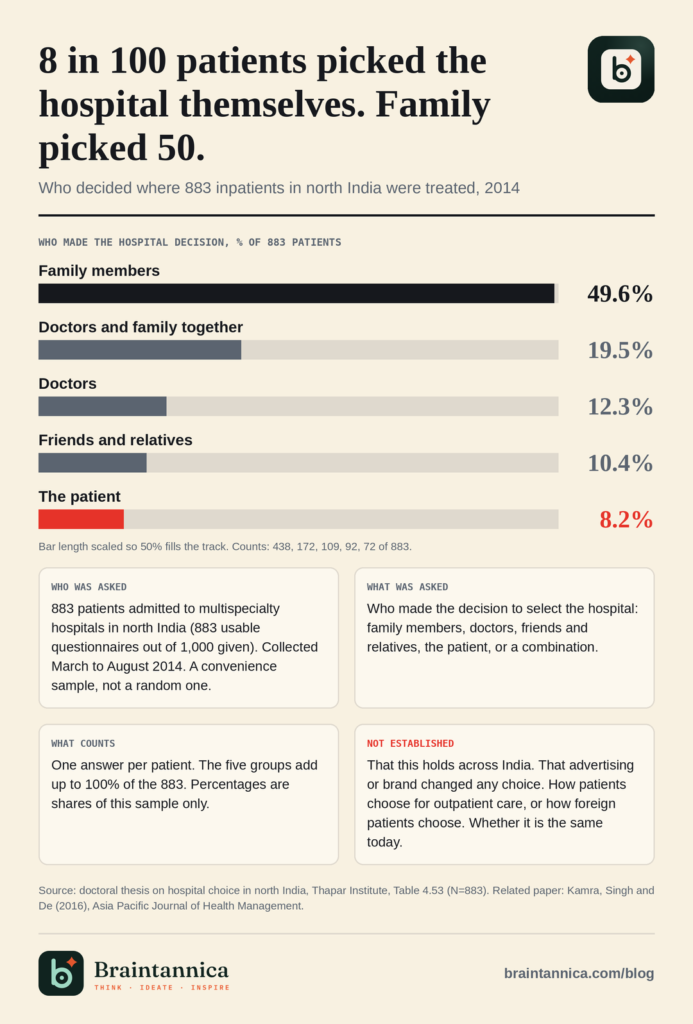
Ask a hospital what drives patient choice and you will hear: our doctors, our brand, our ads. Ask patients and the answer is often someone else in the family. The infographic above sets out one study of inpatients and what it does and does not show. This article puts it next to the national numbers: where Indian patients actually go, what it costs them, and what no survey has yet measured.
Start with the national survey
The largest public dataset on this question is the National Sample Survey, 75th round, run by MoSPI between July 2017 and June 2018. It covered 113,823 households (64,552 rural and 49,271 urban) and 555,115 individuals, using a stratified multi-stage design. Inpatient stays were recorded over a 365-day reference period and outpatient ailments over 15 days.
Note: These are household responses about care that people reported receiving. They are not hospital records, and they are now several years old. Use them for the shape of the market, not for this year's exact shares.
Where patients go
Hospitalisation (excluding childbirth): private hospitals accounted for 55.3% of cases nationally, public hospitals for 42.0% and charitable, trust or NGO hospitals for 2.7%. In rural areas the split was 51.9% private and 45.7% public. In urban areas it was 61.4% private and 35.3% public.
Outpatient care: private doctors and clinics treated 42.5% of ailments, government hospitals 30.1% and private hospitals 23.3%. Urban patients used private hospitals more (27.3%) than rural patients (20.8%). Allopathy was the system of choice for 95.4% of treated ailments.
Note: The urban-rural gap in private inpatient use is 9.5 percentage points (61.4% against 51.9%). Outpatient visits are also a front door: a large share of care begins with a private doctor or clinic, not a hospital. That is where many referrals are decided.
What a choice costs, and who pays
The average medical expenditure per hospitalisation case was ₹31,845 in private hospitals and ₹4,452 in public hospitals. That is about 7 times higher (31,845 divided by 4,452 is 7.15). Choosing private care is a large financial decision for most households.
Household income or savings was the main source of funds for 79.5% of rural and 83.7% of urban hospitalisation cases. Borrowing financed 13.4% of rural and 8.5% of urban cases. At the time of the survey, 85.9% of rural and 80.9% of urban individuals had no health expenditure coverage. Source for these figures: MoSPI Report 586, with press coverage in Down To Earth.
What research says about the reasons
A study of hospital choice in India (Ghosh, 2015, International Journal of Health Care Quality Assurance) identifies five groups of factors: quality of treatment, referral, convenience of transport, cost, and safety and services. Referral sits next to quality and cost, not below them.
Note: This is a list of factors, not a ranking with percentages for all of India. Be careful with any chart that gives a neat ranked list of reasons without naming who was asked and how many.
What the numbers cannot tell you
The national survey tells you where patients went and what they paid. It does not measure the effect of a hospital's advertising, a campaign's return, or which touchpoint led to a booking. No source used here does. If someone quotes a percentage for "how much advertising influences hospital choice" in India, ask for the study, the sample and the year.
What this means for hospital marketing and MVT teams
This section is my reading of the data, not a finding of the studies.
- Count who decided, not only who enquired. The person on the phone may not be the person who chose. Record the role of the enquirer: patient, spouse, child, referring doctor, agent.
- Track the referral source on every enquiry. If referral is a major route, it should show up in your own data. If it does not, your intake form is not asking.
- Respect the cost gap in your messaging. With most households paying from savings, price clarity and package transparency are part of the decision, not an afterthought.
- Treat the first doctor as a channel. Many patients start at a private doctor or clinic. Relationships there matter as much as visibility online.
- International patients are a separate question. These surveys cover Indian residents. Do not assume the same pattern holds for patients travelling to India. Test it with your own enquiry data.
Sources
- MoSPI, Summary Analysis, Report 586: Health in India, NSS 75th Round (July 2017 to June 2018)
- PIB, Press release on NSS 75th round health survey
- Down To Earth, Private hospitals grow more expensive even as insurance coverage remains low
- Down To Earth, Over 80% Indians not covered under health insurance: NSSO survey
- Doctoral thesis on hospital choice in north India, Thapar Institute, Table 4.53, decision-makers in hospital selection (N=883)
- Kamra, Singh and De (2016), Factors Affecting Hospital Choice Decisions: an exploratory study of healthcare consumers in Northern India, Asia Pacific Journal of Health Management
- Ghosh (2015), International Journal of Health Care Quality Assurance